Kurzius Math Notes
Mean and median in data displays
Mean is the sum of the data entries divided by the number of entries. Written with symbols, that looks like
\[\bar{x} = \frac{\Sigma x}{n}\]We use $\bar{x}$ (“x bar”) to represent the mean and $n$ for the number of items. The Greek letter $\Sigma$ (“sigma”) represents “sum of”, and that we are adding up all the data entries $x$.
A quick note about the word “average”. Words are jazz and people tend to do whatever they want with them in casual speech. The word “average” is a casualty of this. An average is any single number or value that best represents a set of data. Most people have gone on to assume that average means taking the sum of everything and dividing by the number of items, but median or mode could be a better representation depending on the situation.
The median of a set of data is the middle number when they are arranged in order. If you have an odd number of entries, this is straightforward.
\[3 \quad 4 \quad 5\]But when you have an even number of items
\[3 \quad 4 \quad 5 \quad 6\]you need to find the midpoint of the two middle numbers (or their mean). So, for the first set, the median is 4 and the second set has a median of 4.5.
Mode
Worth mentioning, though we won’t do much with it, is the last measure that is usually mentioned in the same breath as mean and median. Mode is just the data entry that appears most often. Depending on the case, a frequency class could be looked at rather than a single value. You can spot the mode in a chart by looking for the peak (or peaks if it’s multimodal).
Estimating mean and median
We’ve looked at histograms earlier, but now we’ll go back and talk about their shape, which is dictated by their measures of central tendency.
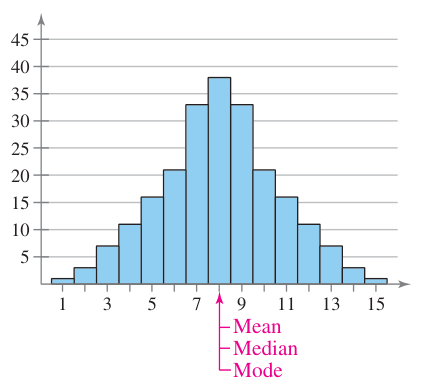
First up is a symmetrical distribution. This is when the mean, median, and mode are all roughly equal and the graph appears the same on both sides of those measures.
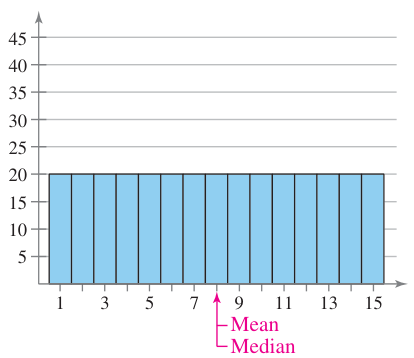
A uniform distribution is when each entry or class has about the same frequency. The mean and median are equal, but there is no mode.
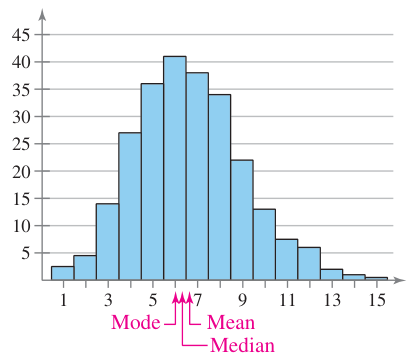
Skewed distributions are when the bulk of the data tends to one side or another. The naming on this can be confusing, so before we get into it I need to point out what happens to the mean in a skewed distribution.
When the data is skewed, the median will “follow” the bulk more closely than the mean. The median doesn’t care how big or small the numbers are, it’s just the middle one. Mean on the other hand, is affected by the magnitude of each entry, so even though the bulk of the data is on one side, it’s still being pulled down by the opposite end of the graph.
So, when we talk about a left-skewed distribution, its called that because the mean falls to the left of the median. This is also a called a negative skew since the mean is on the negative side of the median.
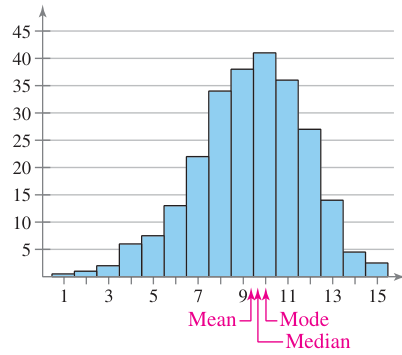
Conversely, a right skewed distribution sees the mean on the right side of the median, and is also known as a positive skew.
Don’t be temped by the bulk of the data. Try and remember that it’s the position of the mean relative to the median that determines its name.