1.2 Finding Limits Graphically and Numerically
- Estimate a limit using a numerical or graphical approach.
- Learn different ways that a limit can fail to exist.
- Study and use a formal definition of limit.
Assignment
- Vocabulary and teal boxes
- p72 1, 2, 5, 6, 9, 10, 15, 16, 19, 22, 24–27, 29, 30, 51–57 odd, 61 64–68, 77–80
The vertical bar indicates the AP cut-off. Problems after the bar are recommended for AP prep, but not required for the assignment.
Additional Resources
- AP Topics: 1.2, 1.3, 1.4, 1.9
- Khan Academy
An Introduction to Limits
Here’s a function.
\[f(x) = \frac{x^3-1}{x-1}\]Sketching this wouldn’t be too difficult. Pick some $x$-values, plug them in, generate $y$-values, and you’ll get a parabola as a result (degree 3 on top, divided by degree 1 on bottom, leaves you with $x^2$).
But what happens when $x=1$? The function it self won’t evaluate since you are dividing by zero, but what does it look like the function is doing? What happens when you plug in values that get closer and closer to $x=1$? As you plug in numbers that approach 1 from the negative side (0.9, 0.99, etc.) and then numbers from the positive side (1.1, 1.01, etc.), you’ll that both sets of numbers look like they are heading towards a value of 3.
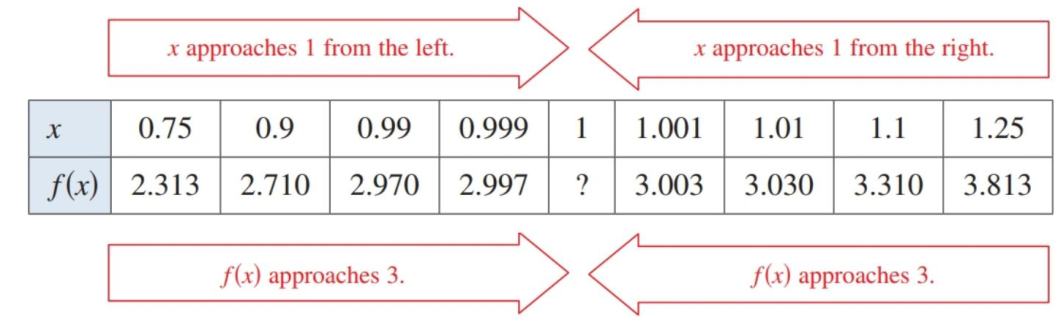
And if you were to graph it with Desmos or a calculator, you would see the same thing. Technically, there’s a gap, but it is definitely heading towards 3. The limit of $f(x)$ as $x$ approaches 1 is 3. We write that as
\[\lim_{x\to1}f(x)=3\]Let’s look at a different case.
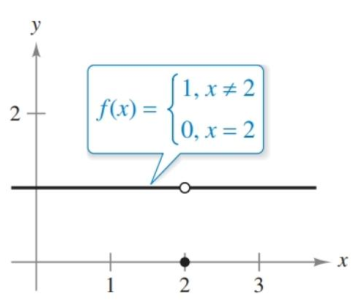
\[f(x) = \begin{cases} 1, & x\neq2 \\ 0, & x=2 \end{cases}\]Here, there is distinct difference between $f(2)$ and $\lim_{x\to2}f(x)$. The former is clearly defined–when $x$ is 2, then $f(x)$ is 2–but the limit, what the function appears to be doing as it approaches $x=2$ is 1.
Limits That Fail to Exist
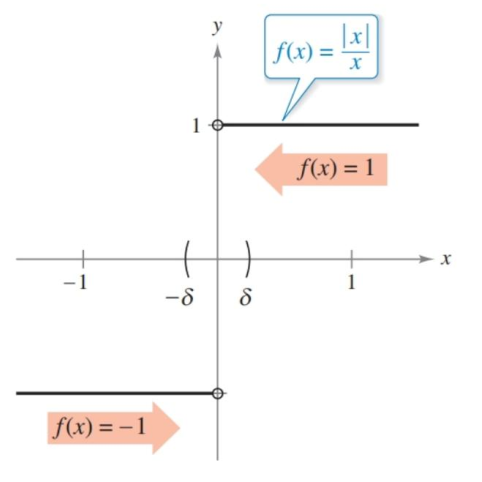
| There are some situations where limits do not exist, where it can’t be determined what the graph is actually doing when it approaches a given value. One is different right and left behavior, which is when approaching a value from different directions yields different values. The graph of $f(x)=\frac{ | x | }{x}$ is one example. |
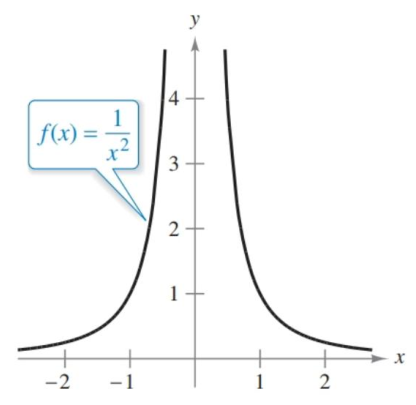
Unbounded behavior is example. This is where the graph takes off to infinitely while approaching the value in question.
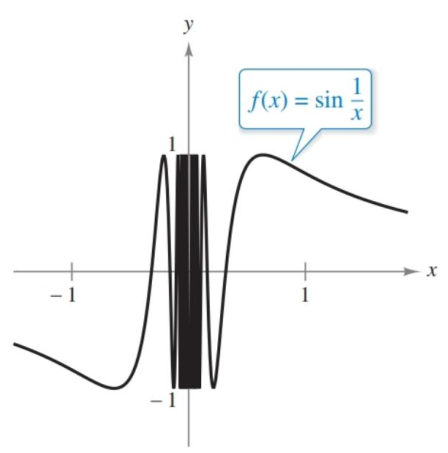
The last one is oscillating behavior. This is when the oscillations of a function increase as they approach a value, never settling on a specific point.
A Formal Definition of Limit
We’ve seen
\[\lim_{x\to c} f(x) = L\]meaning that if $f(x)$ becomes really close to a single number, $L$, as $x$ approaches $c$ from either side, then the limit of $f(x)$ as $x$ approaches $c$ is $L$.
This is technically not a well-defined definition of a limit, because what is meant by “really close” and “approaches”? There is a more technical version, called the epsilon-delta definition, written out in the text, and I can also recommend this Khan Academy video on the topic, but CollegeBoard is very clear about this not appearing on the exam.